Spacing is a safety constraint before it is a fact
How far apart the vessels sit decides what can be worked on at once and what has to wait. Reading it off the plant rather than off a drawing is the difference between planning and assuming.
A petrochemical plant in the Cai Mep industrial zone in southern Vietnam, rebuilt in 3D from nine stock drone clips. Every sphere measured on the 3D, two crawler cranes placed by where their sight lines meet, and the coating on every sphere read across six views. Our own demonstration: nobody commissioned it, and the plant and its operator are not named.
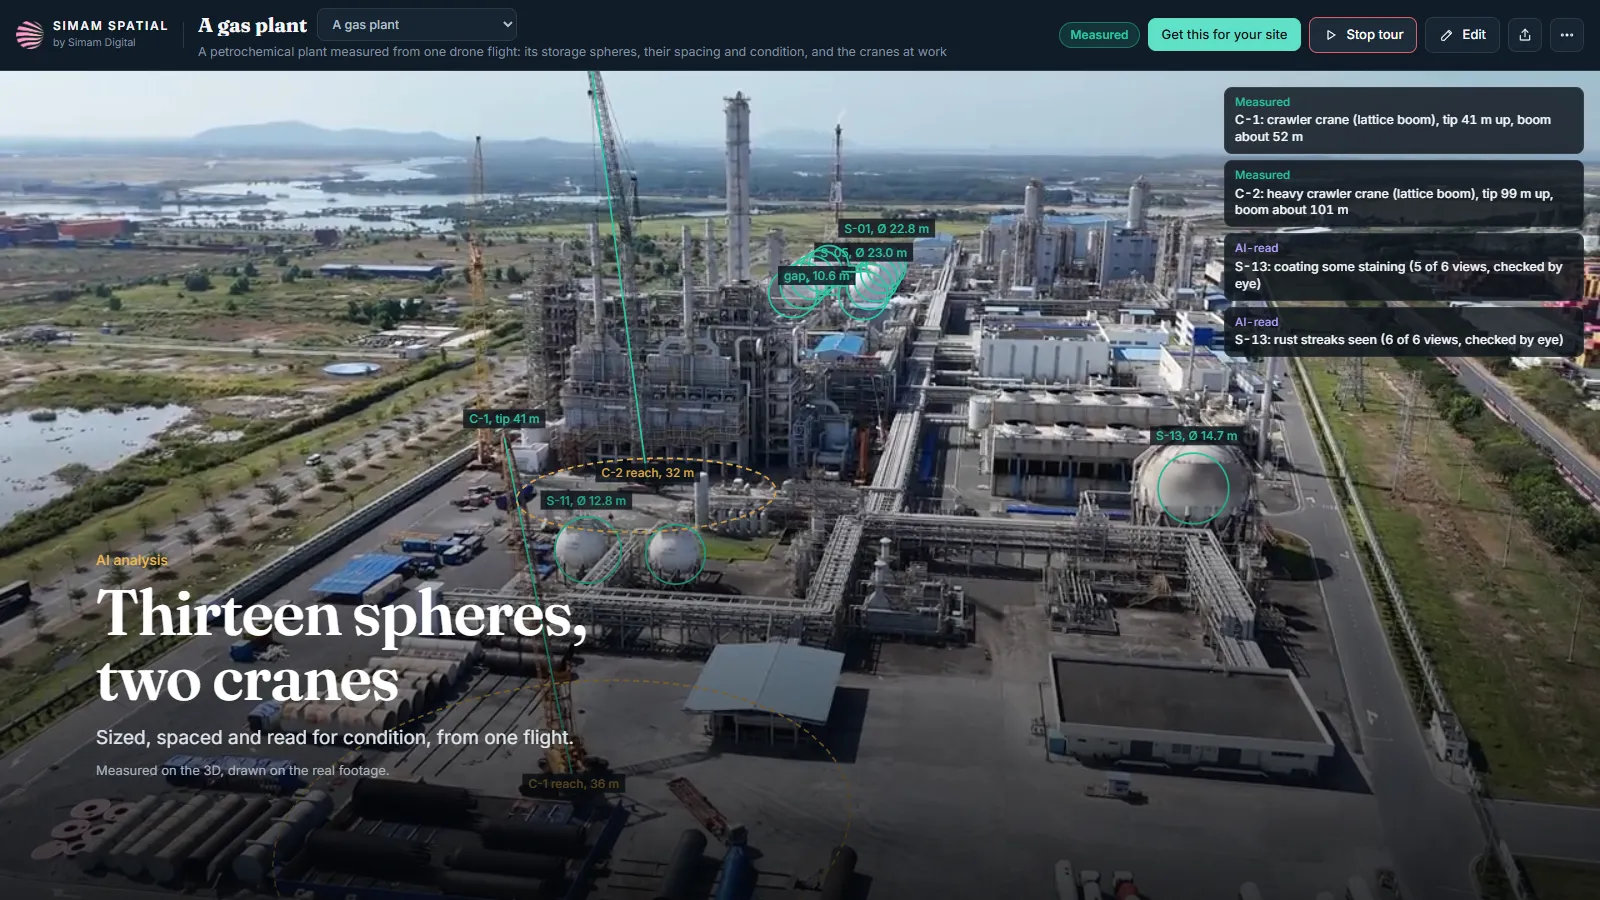
A process plant is a dense site where almost nothing can be measured by walking up to it. Vessels are large, hot, fenced or live; cranes come and go; and the questions people need answered are about sizes, spacing and what has changed. The drawing answers what was built, which is not the same question.
Clearance between vessels, the reach of a crane, where a hazard zone ends, how far a muster point is. These are the questions that govern what work can happen and when, and all of them are distances. On a site where you cannot stand next to most of the things you are asking about, that is a hard way to run.
How far apart the vessels sit decides what can be worked on at once and what has to wait. Reading it off the plant rather than off a drawing is the difference between planning and assuming.
A crane’s reach against the nearest vessel is the whole of the question for a lift plan, and it is a measurement that exists for a few weeks and then stops existing.
Coating and corrosion are judged by whoever walked past most recently. There is rarely a dated picture behind the judgement and almost never one of every vessel.
Getting a person to the right place on a live plant is permits and time. A drone orbit is neither, which is what makes doing this repeatedly thinkable.
Thirteen vessels measured on the 3D, with the gap between them, rather than taken from a document.
Both crawler cranes placed in 3D with their boom tips and their reach drawn on the ground, from the same footage.
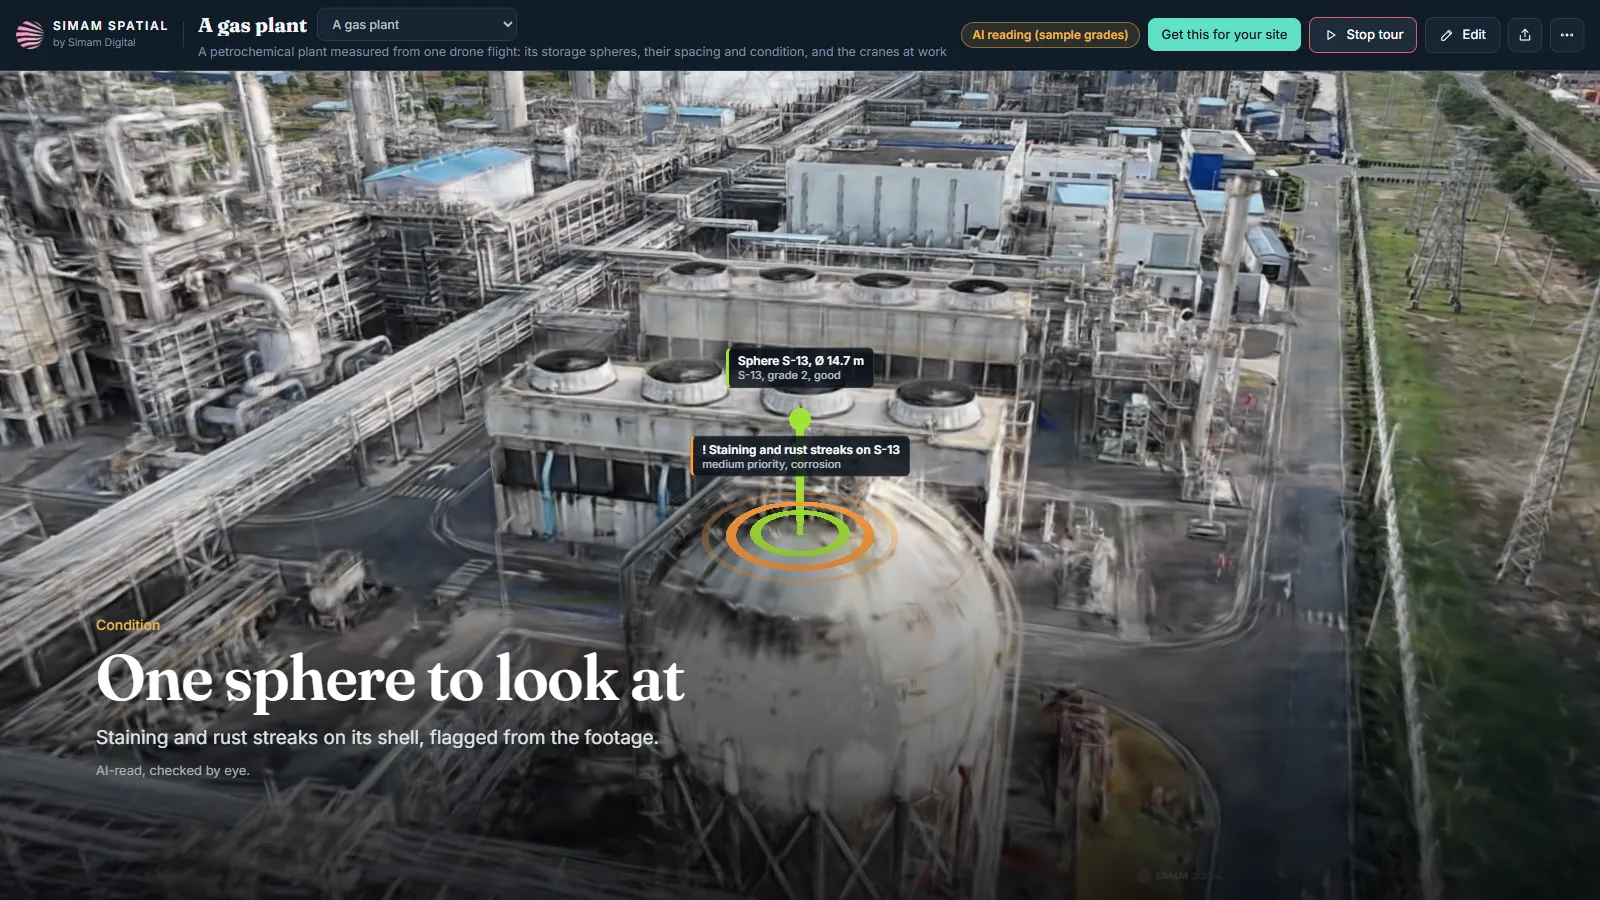
Every sphere’s coating read across six views, with the one worth looking at flagged and then checked by a person.
Nothing about this pass is bespoke. Fly it again and the second pass is a comparison rather than a fresh start.
None of these is decided by the model. Each is a person deciding, with a measurement in front of them instead of a drawing and a memory.
Every figure on this page says what kind of figure it is. That is the whole of why it can be used.
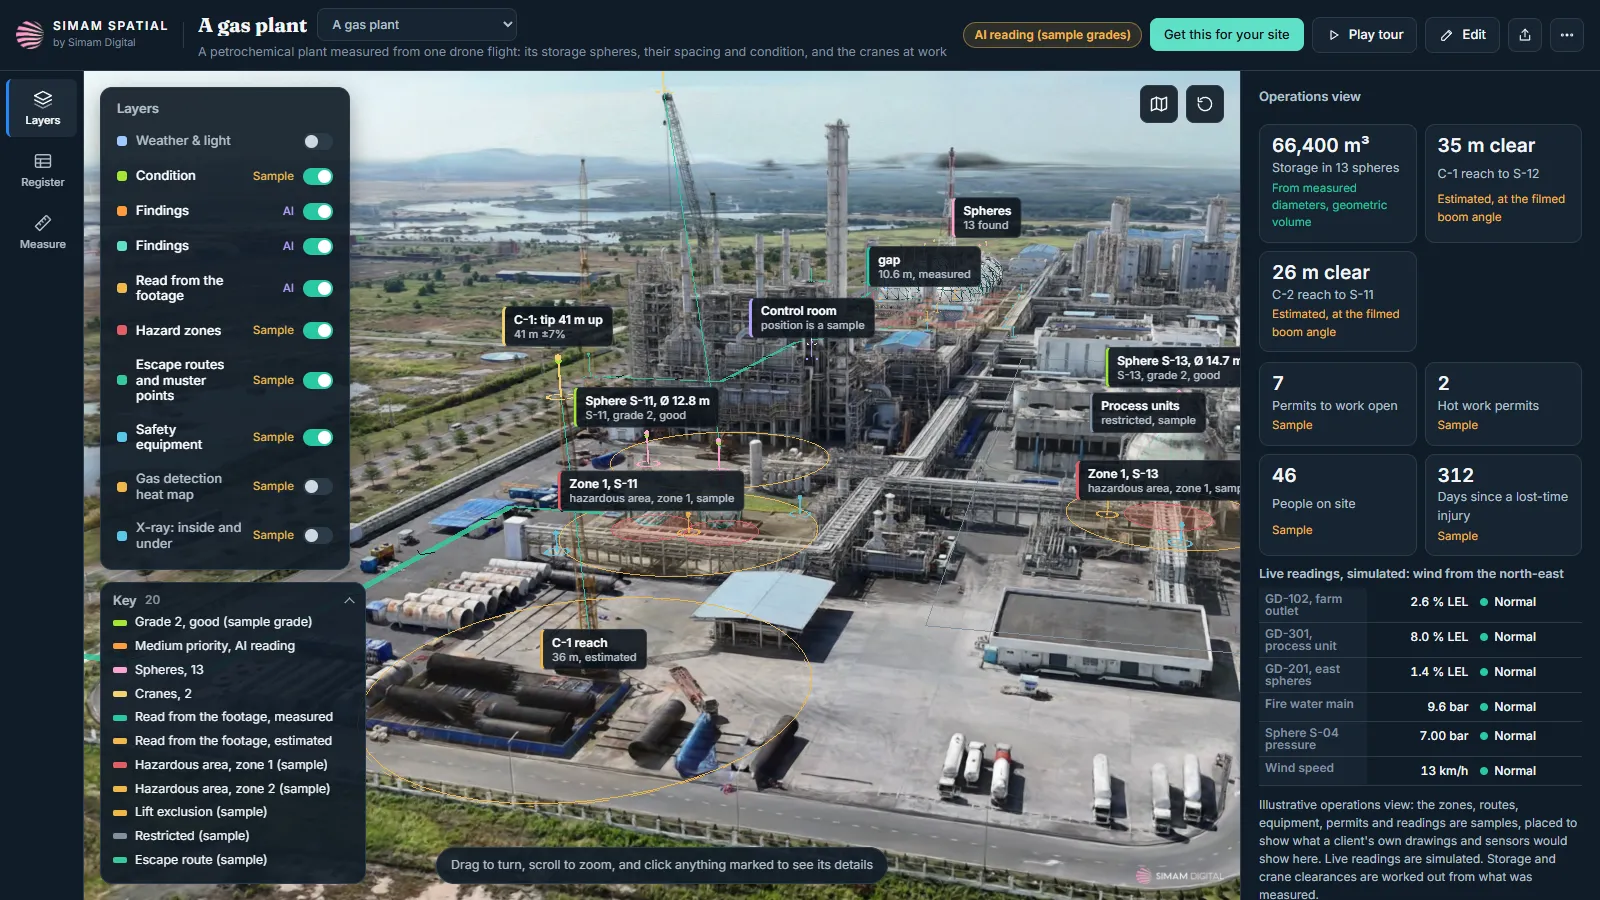
Sizes carry about seven per cent, which is what reading scale off the footage rather than off ground control costs. Good enough to compare with and plan with, not good enough to settle anything.
The coating readings are AI, raised for a person to confirm. Nothing here grades a vessel or clears one.
Every reading in it was invented to show the shape of the thing. None of it is a real plant’s.
Nothing about time or cost on a real plant was measured here, so there is no figure for it and we are not inventing one.
Built on stock footage, as our own demonstration. Nobody commissioned it: it exists to show what the method does on a working industrial site rather than on a tidy one. The site and its operator are not named here and are not ours to name.
Yes, a working petrochemical plant, and the footage is stock. Nobody commissioned this and the operator has no involvement in it. The operator’s name is painted on one sphere and is blurred in the films and flattened in the 3D.
About seven per cent either way. Scale comes from truck cabs of a known size in the footage rather than from ground control, which is what that figure is the price of. It is good enough to compare vessels and to plan with, and not good enough to settle anything.
AI read the coating on all thirteen across six views and raised one. A person then looked at it. The output is a shortlist for an inspector and the page says so on the picture, because a condition verdict from a drone pass is not a thing we can honestly sell.
Hazard zones, escape routes to muster points, safety equipment, a gas-detection map and an X-ray of fill levels and buried lines. All of it is sample data. It shows the shape of what an operations layer would do on your plant with your data in it, and it is not any real plant’s readings.
One hour thirty-seven minutes from footage in to the finished 3D, on one desktop graphics card. That is the machine time, not the reading and the checking round it.
The large white vessels were first fitted as upright tanks. Looked at again they are spheres, and they were measured as spheres. The first patch over the operator’s name also covered the back of a sphere the drone never saw; it now covers only the side it did.
Not as an open demo. We show it on a call, because what is worth showing is how it answers your questions rather than this plant’s.
Drone orbits at a couple of heights, flown by pilots who already fly them, and something of known size in frame for scale. If you can give us ground control, the seven per cent comes down.
Tell us what it is and what you need to know about it. We will say whether this would answer it, including when it would not.