A lender pays against progress it cannot see
A monitoring surveyor visits periodically and reports on what they saw. Between visits, the position is whatever the borrower says it is.
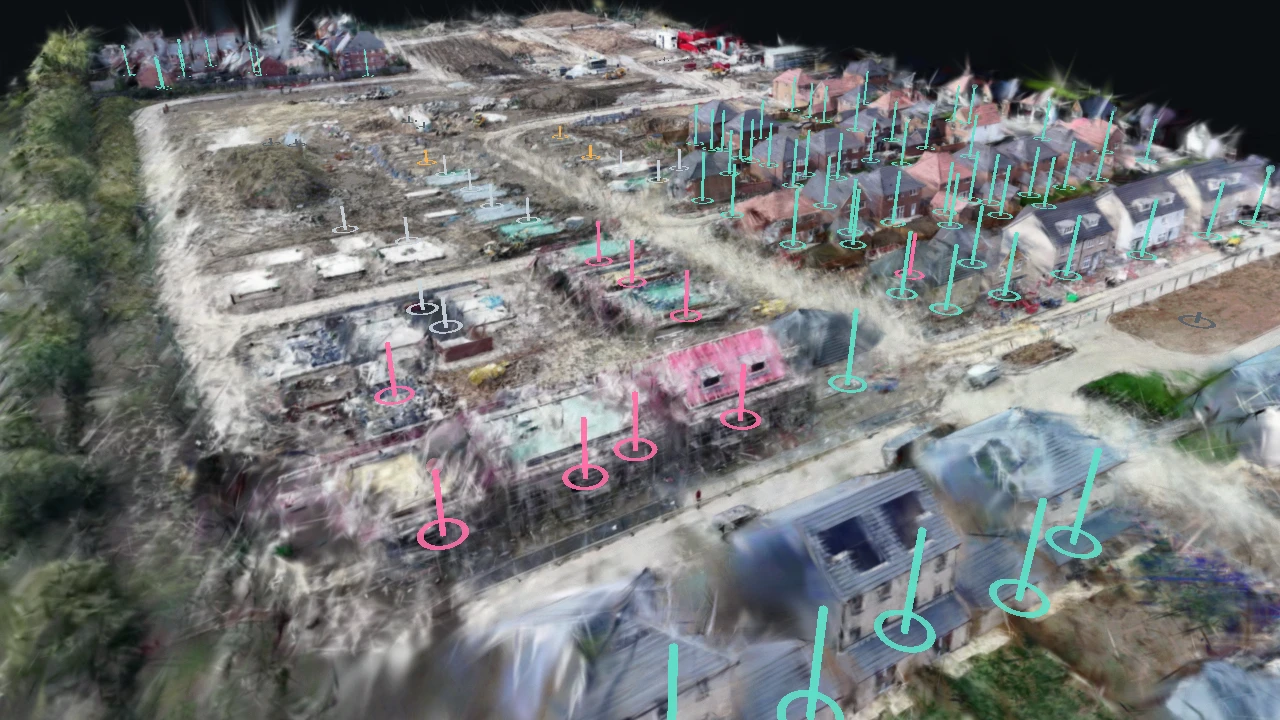
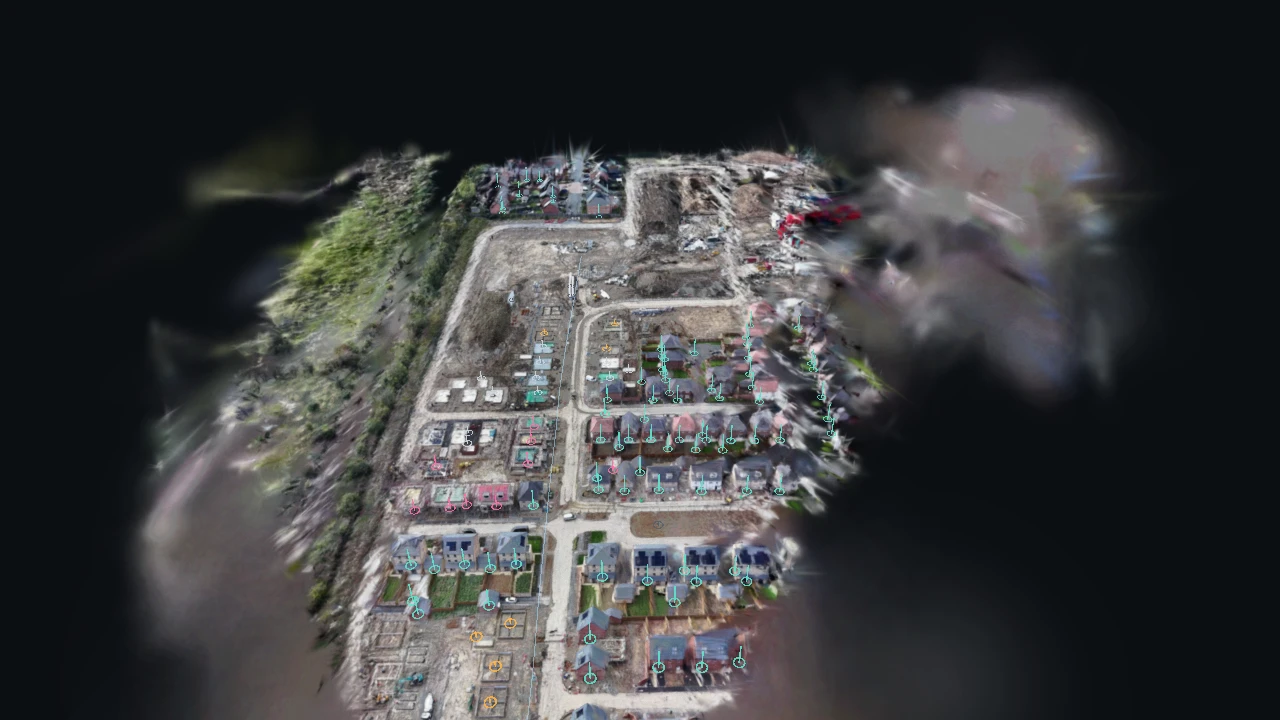
One 44-second pass over a new-build site becomes a model with a pin on every plot and a stage against each one: foundations, slab, structure going up, or roofed. Click a pin and you get the frame it was seen best in. Our own demonstration on stock footage, and the page publishes what it got wrong as carefully as what it got right.
Progress on a housing site is reported by the people building it, in words, once a week or once a month. By the time it reaches a commercial manager or a lender it is a number in a spreadsheet with nothing behind it, and the only way to check any of it is to walk the site.
Valuations, drawdowns and subcontractor payments all hang on how far each plot has got. That is a question about a hundred small things spread over a muddy field, and the people who need the answer are usually not the people standing in it.
A monitoring surveyor visits periodically and reports on what they saw. Between visits, the position is whatever the borrower says it is.
and cannot be on all of them. The reporting they rely on is the thing least likely to carry a picture.
because it surfaces at valuation, when nobody has a record of what the plot looked like at the time.
which is the whole reason this is worth trying: the same flight next month is a comparison, not a fresh start.
113 of them found and placed from one pass, rather than whatever a walk covered.
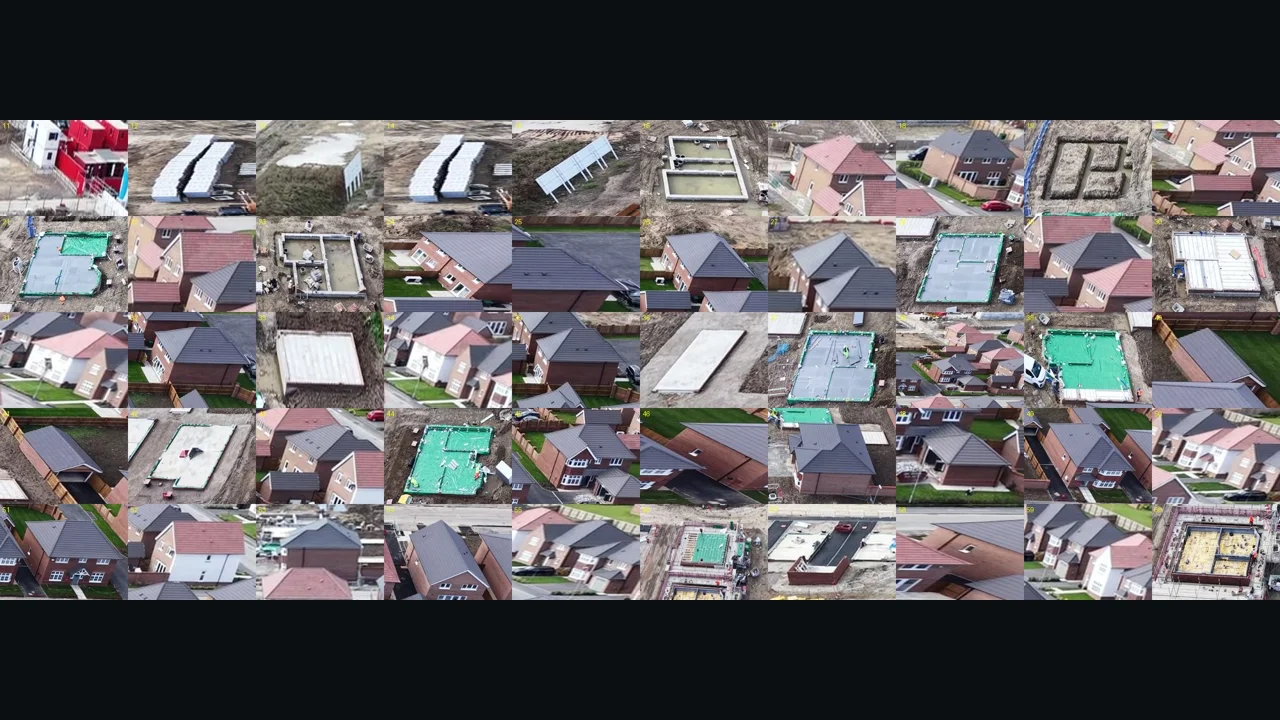
Each pin opens the frame that plot was seen best in, so a stage is a claim somebody else can check.
Read from the footage by software and scored against a person’s labels, with both shown.
One pass is one moment. The value is in the second one.
None of them is settled by the software. Each is a person deciding, with a dated picture of every plot instead of a line in a report.
Every figure on this page says what kind of figure it is. That is the whole of why it can be used.
These are the readings that are weaker, and they are here rather than quietly left out. Each one is an estimate for an engineer or a site manager to confirm, not a finding.
It is a second source with a picture behind every claim, which is a different thing from a report by somebody who was there.
The walkable and blocked map is a planning sketch. It is not a sign-off and should never be used as one.
Distances rest on parked cars and carry about twenty per cent. They are for finding things and planning a walk, not for setting anything out.
Nothing here was compared against a site walk or a monitoring visit, so there is no figure for what it saves and we are not inventing one.
Built on stock footage, as our own demonstration. Nobody commissioned it: it exists to show what the method does on a working industrial site rather than on a tidy one. The site and its operator are not named here and are not ours to name.
It is a modest gain, and the page prints the number that says so. Calling every plot "roofed" without looking at anything scores 70 per cent on this site, because three quarters of it is roofed. The gain that matters is on the unfinished plots: 25 of 29 right against 0 of 29 for the lazy answer, and those are the plots anybody is actually asking about.
It calls 12 of the 84 finished houses "structure", which is why the page shows the labels made by eye first and the software’s reading beside them rather than instead of them. It also recognised none of the 7 things that were not plots: a cabin, some material stacks, a sign and a mound all got pins.
Finding site cabins. It got 3 of 84 right, calling houses and slabs cabins, and we dropped the feature rather than ship it. The first three ways of reading the stage failed too: one answered "slab" 117 times out of 120 and was unusable. It only worked once the question was split in two, asking about the roof first.
Treat it as a planning sketch and not a safety sign-off. Its score is also the weakest thing on this page, because the eye labels for it were made after seeing the model’s answers. We are telling you that rather than letting the number stand on its own.
No. One flight is one moment. The sequence view orders plots by stage, which reads like time and is actually space. A real progress record needs repeat flights, which is the obvious next thing to do and has not been done here.
About twenty per cent either way. Scale comes from parked cars of assumed size rather than from ground control, so the walk of about 200 metres from the cabin to a typical unfinished plot, against 169 metres in a straight line, carries that margin.
Stock footage of a UK-style new-build site. Nobody commissioned this, the site and its builder are not named, and nothing here implies a connection with either.
One drone pass. If you fly your sites already, you have the input. The thing worth doing after that is flying the same site twice.
Tell us how many and how often they are flown. We will say whether this would answer what you need, including when it would not.