A dated record anybody can open
What the site looked like on the day, from a link, without a hard hat or a gate pass.
A hotel tower in Las Vegas, stripped floor by floor and kept as a dated record anyone can open. How far the strip-out has got, how much is sitting on the podium roof, and the same site in March against June. Nobody walked the structure to find out.
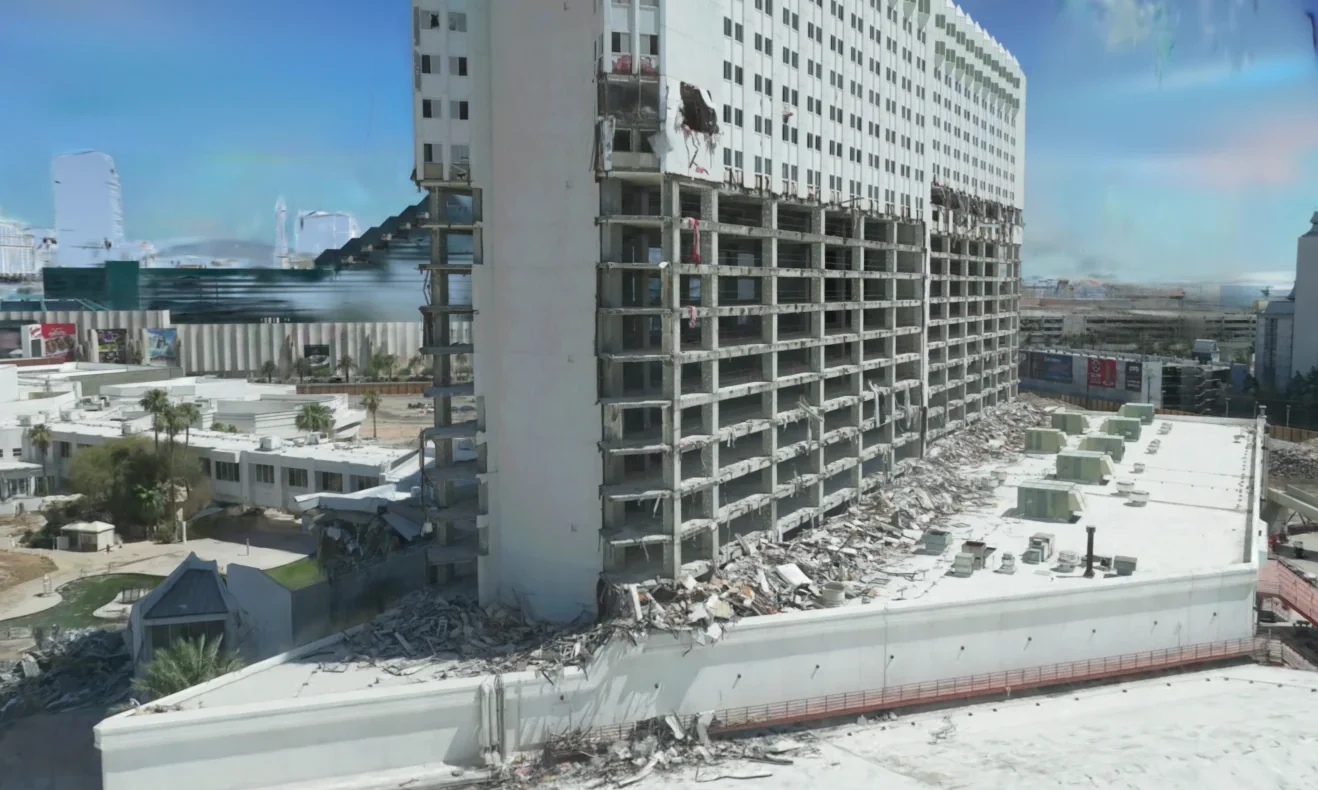
A building being taken apart changes every week, and the structure is the one place nobody wants to send somebody to look. So progress is reported in words, volumes are priced off a guess, and the disagreement turns up later attached to an invoice.
What the site looked like on the day, from a link, without a hard hat or a gate pass.
The debris on the podium has a figure and a spread. You can price against the spread instead of against somebody’s impression.
March against June, in the same view. Change you can see rather than change described to you.
The record carries real coordinates, so it lines up with everything else you already hold about the site rather than living on its own.
Every figure on this page says what kind of figure it is. That is the whole of why it can be used.
These are not measurements and they are not presented as any. Software read one photograph from each visit and a person checked every reading against the photograph it came from.
Every figure below is an estimate for an engineer to confirm. None of it was weighed, counted or measured, and none of it should be priced against without someone checking it.
The same four conditions, graded the same way on every visit, plus the stripping itself so the job going to plan sits beside the things that were not. 32 dated readings in all, 32 of them checked by a person before anybody saw them.
| What was watched | 19 Mar | 12 Jun | 24 Jun | 02 Jul | 19 Jul | 07 Aug | 03 Sep | 13 Sep |
|---|---|---|---|---|---|---|---|---|
| Loose material hanging from the exposed slab edgesdamage | – | 4 | 3 | 2 | 2 | 1 | 1 | 2 |
| Chipped and broken concrete along the slab edgesbroken concrete | · | 2 | 2 | 2 | 2 | 2 | 2 | 2 |
| Rubble on the low roof beside the towerdebris | – | 3 | · | 3 | – | 4 | 4 | – |
| Broken cladding on the remaining white wall panelsdamage | · | · | · | 3 | · | · | 3 | · |
| Planned works: cladding stripped from the towerplanned works | – | 2 | 3 | 3 | 3 | 4 | 4 | 4 |
Read from close crops of Airweb's drone photos of each visit and graded on one scale across dates. AI drafts, checked by a person on 9 November 2026. The photos are wide shots, so cracks, rust and staining could not be read reliably and are not listed.
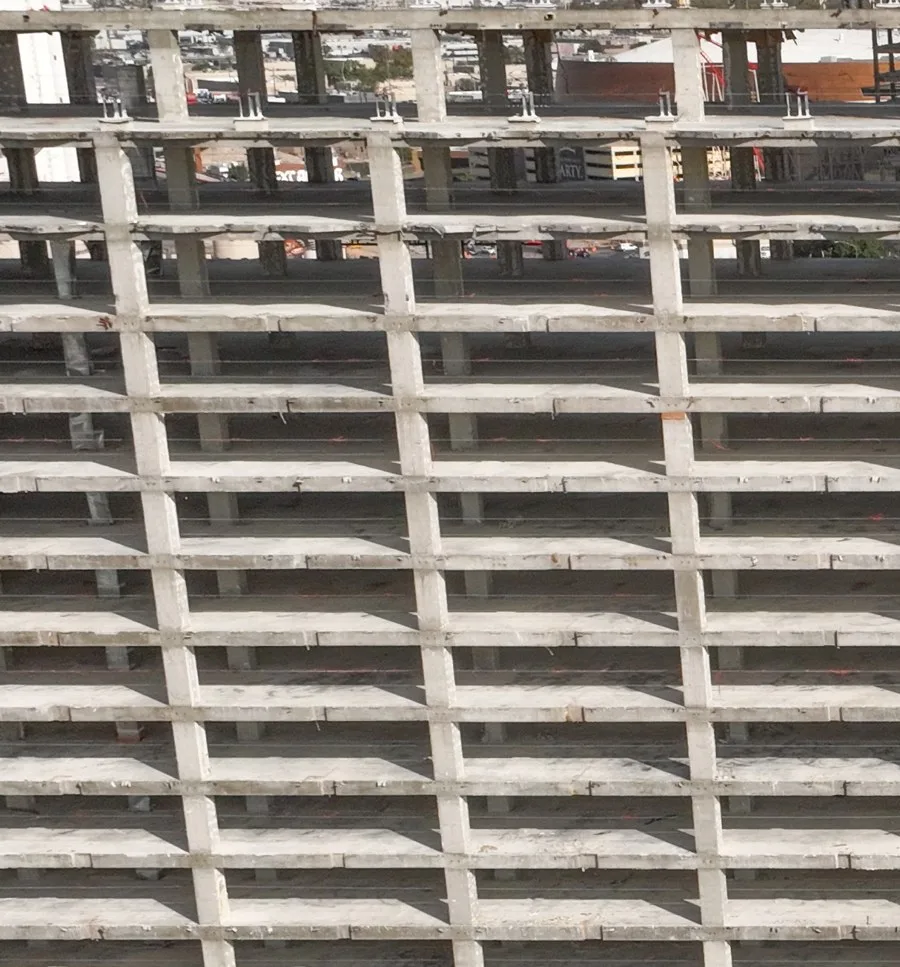
Both crops come from the drone photographs of those two visits. Nothing is redrawn.
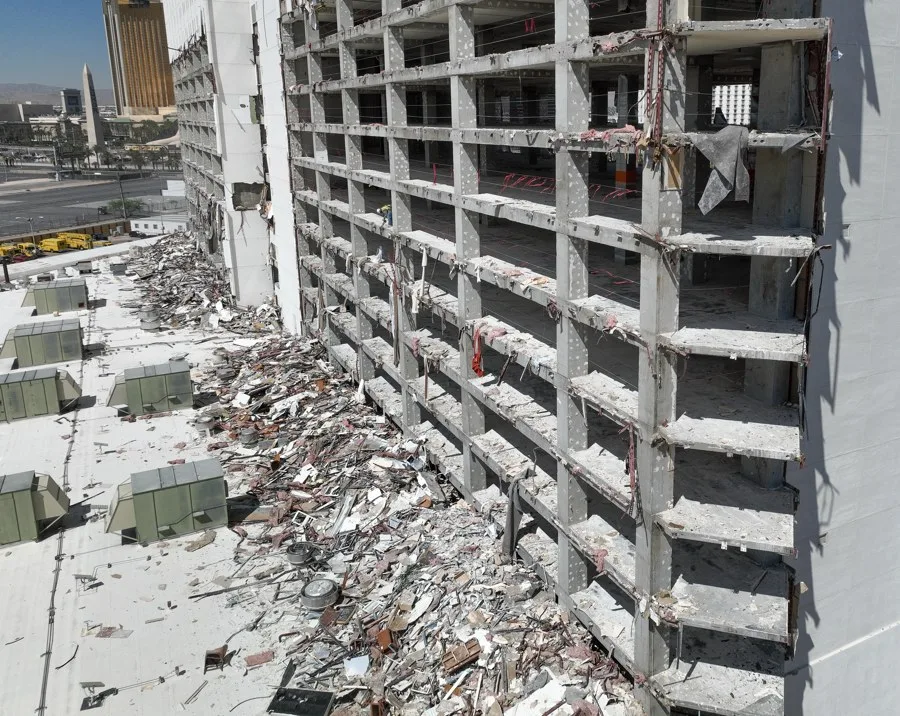
About 684 cubic metres, and anywhere between 427 and 975. That is a wide range and it is published wide on purpose. Taking the middle of it as the answer is the mistake this page exists to stop.
Software read one photograph per visit and a person checked every one. Only 12 June was measured in 3D. Treat the rest as a timeline, not as a survey.
Weights and loads are estimated from volume. Nobody weighed anything, and a demolition contractor should price from their own numbers.
There is no figure here for site visits avoided or days saved. Nobody measured one, so there is nothing to put.
These are good enough to see with, compare with and plan with. They are not good enough to settle anything.

Captured by Airweb’s drone pilot network. The flying is theirs and the reading is ours. Their logo is their own, shown on a dark panel of ours so it is legible here.
Tell us what it is and what you need to know about it. We will say whether this would answer it, including when it would not.