Simam AI Lab Our applied AI research division is now open. Visit the lab
Logistics · our own demonstration

Thirteen trucks tracked in thirty seconds of drone footage.

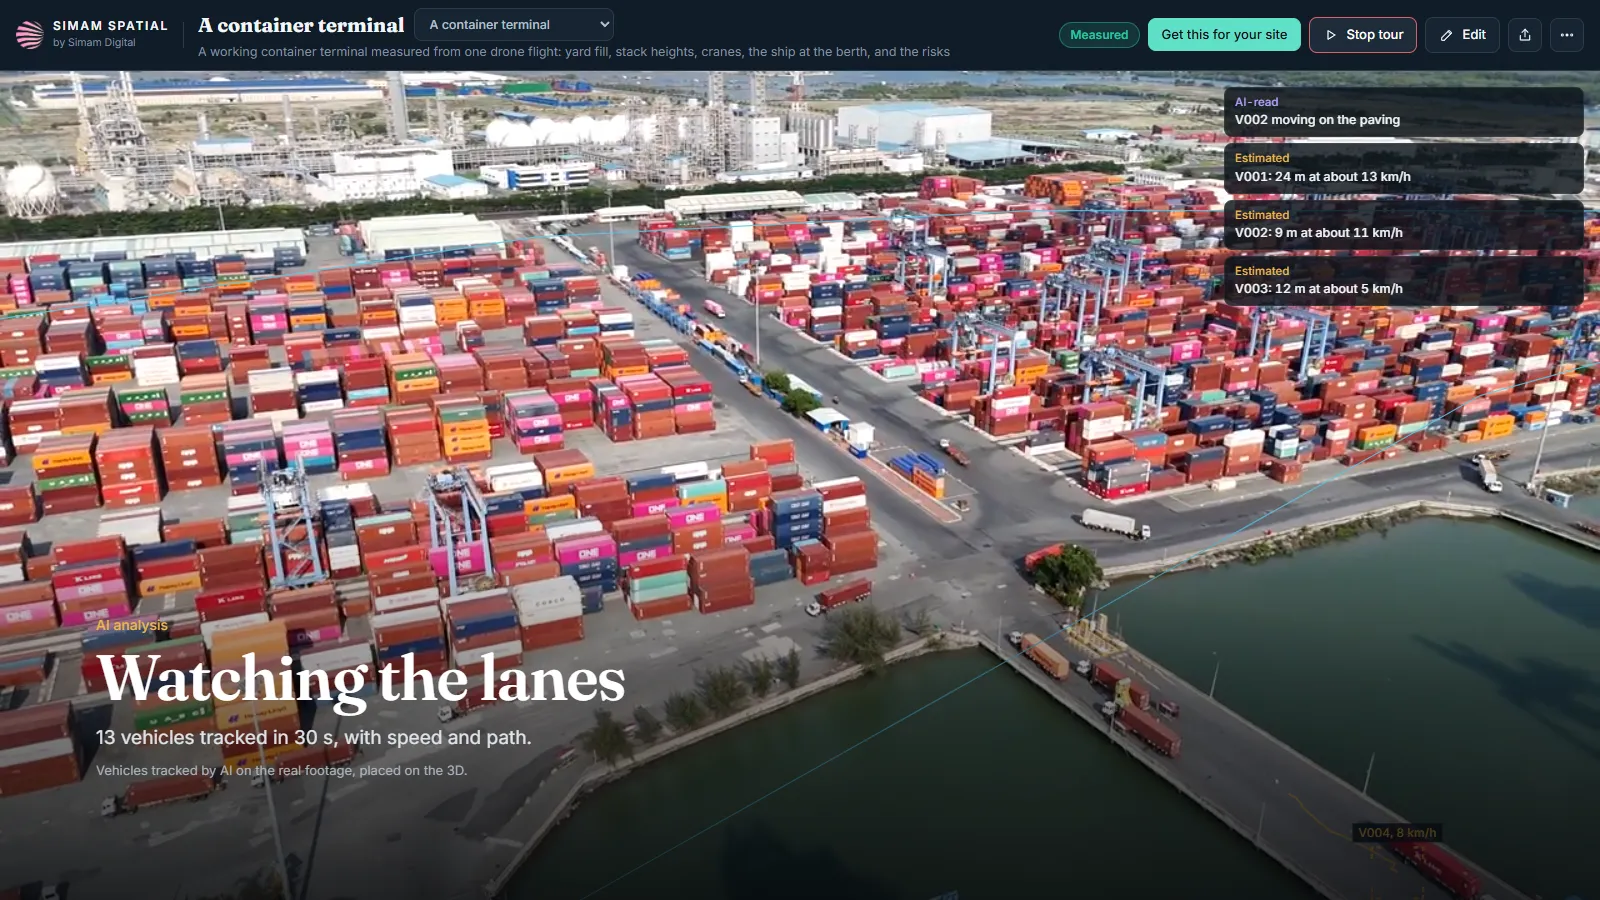
A deep-water container terminal at Cai Mep in southern Vietnam, read from stock drone footage. Every frame has a solved camera position, so anything moving differently from the ground is a vehicle: thirteen trucks tracked in thirty seconds, each placed on the ground in metres. Our own demonstration, and the part of it that did not work is on this page too.

Drone footage of a container yard with the moving trucks picked out, each one carrying its speed and the path it has taken
Thirteen vehicles tracked on the real footage, each placed on the ground in metres with its path and speed. Speeds rest on the 3D’s scale and carry about ten per cent.
The problem

A yard is a thing that moves, and the record is a still.

A terminal’s own systems know what was booked, gated and lifted. What they do not hold is the yard as a place: where the traffic actually goes, how full the blocks are getting, and what the site looks like from the angles nobody has a camera on. Those questions get answered by walking out and looking.

The yard plan and the yard disagree by the hourand the gap is invisible until somebody goes and stands in it.
Traffic is understood from memorywhich lanes are busy, where the queues form, how fast things move. All of it is known and none of it is measured.
Counting is either exact and slow or quick and vaguethe terminal’s own count is authoritative and nobody outside it has one, so everyone else works from an impression.
Why this gets commissioned

Operations run on the yard, not on the manifest.

The commercial questions about a terminal are about space and movement: how much of the yard is working, what the traffic is doing in it, and whether the shape of the operation matches the plan it was designed around. Those are spatial questions, and the systems that run a terminal are not spatial.

Occupancy is the constraint everything else bends around

How full the blocks are decides what can be accepted and where it can go. An independent read of it, even a rough one with its range on display, is a different kind of input from the same number out of the same system.

Traffic shows you the design, not the intention

Where vehicles actually drive and how fast tells you how the layout performs. It is the kind of thing a site plan cannot answer and a shift supervisor cannot be expected to quantify.

The angles that matter are the ones nobody has

Fixed cameras see what they were pointed at years ago. A flight sees the land side, straight down and the berth in one pass.

One pass is a sample of a continuous thing

A terminal is a shift pattern, not a moment, which is why anything read from a single flight is a snapshot and has to say so.

What it changes

What it changes.

Traffic measured instead of remembered

Thirteen vehicles tracked in thirty seconds, each with its path on the ground in metres and its speed.

An outside read on how full the yard is

Counted by AI on 338 views of the real frames and paired with the yard area measured on the 3D.

The angles a fixed camera does not have

The land side, straight above the yard and the evening, each as its own 3D rather than a forced merge.

A method that repeats

Fly it twice and the second pass answers moves per hour and dwell time, which one pass cannot.

What it is used to decide

The questions it is there to answer.

With the honest caveat that one flight is a snapshot rather than a shift, and every figure below carries its range.

Where does the traffic actually go?Every moving vehicle is placed on the ground in metres with its path, so the lanes that are really used can be compared with the ones the layout assumed.
Roughly how full is the yard?Between 7,600 and 12,900 TEU in the main yard, estimated from the AI count and the measured area. It is a range on purpose and it is not the terminal’s own figure.
What does the site look like from the side nobody films?Four separate viewpoints, each its own 3D, one tap apart.
Is this method worth flying properly?That is the question this page actually answers, and the answer is partly no. See below.
The readings

What was read, and what kind of figure each one is.

Every figure on this page says what kind of figure it is. That is the whole of why it can be used.

13vehicles tracked in 30 seconds of footageMeasured on the real frames. Median speed 16 km/h, estimated, because speed rests on the 3D’s scale.
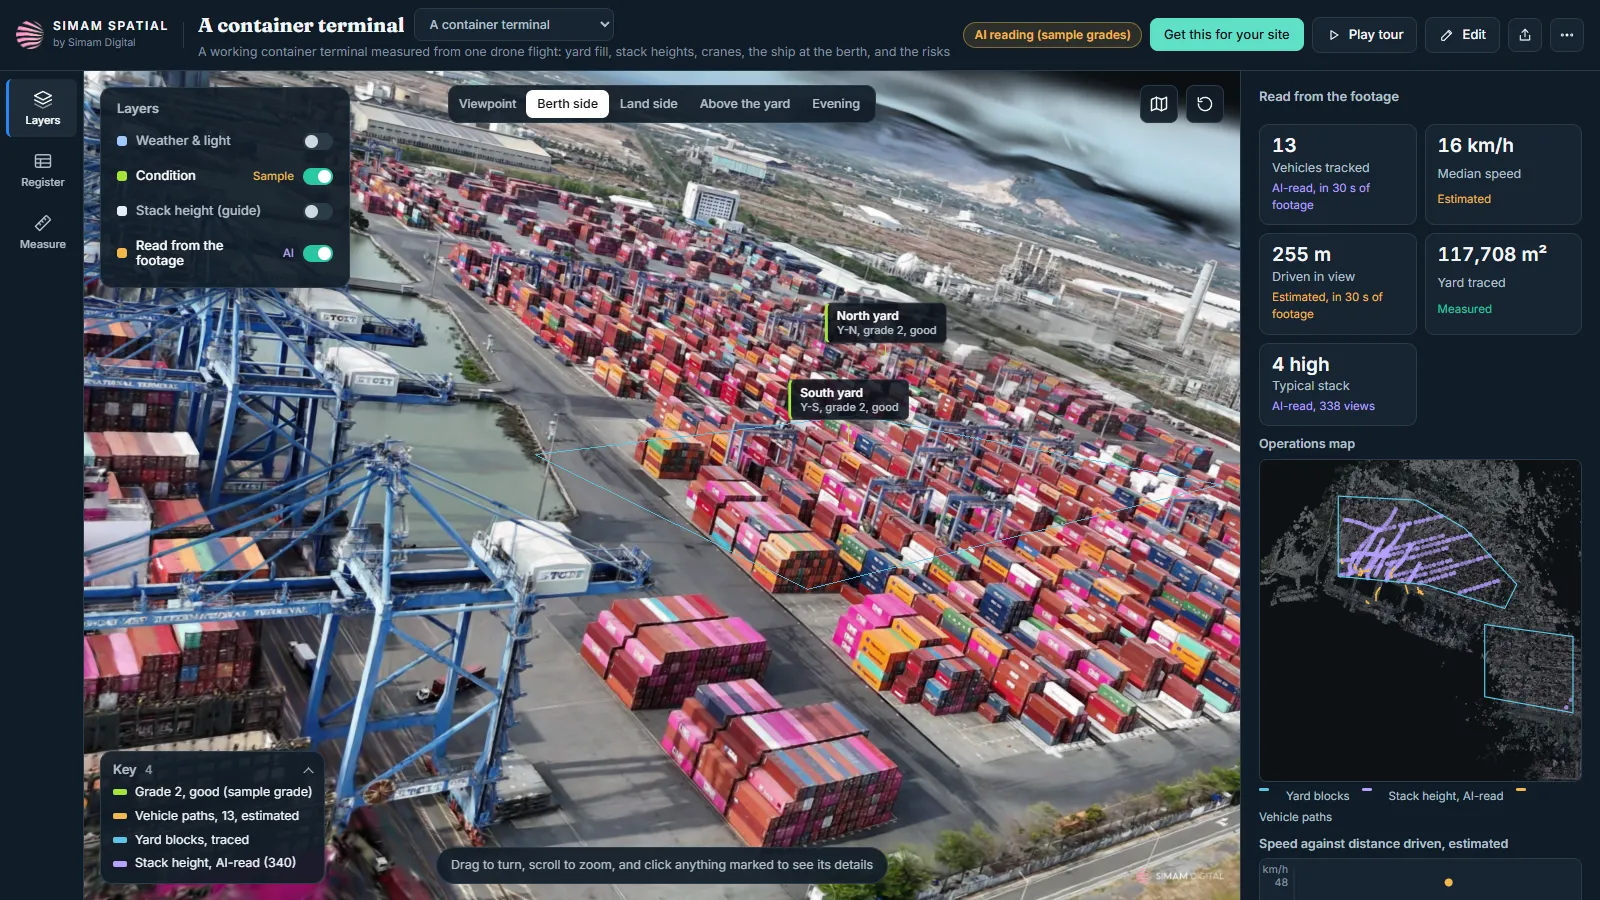
4 highthe typical container stackRead by AI on 338 views of the real frames rather than off the 3D, which was too soft to count boxes on.
7,600 to 12,900TEU in the main yardAn estimate, given as a range. From the AI count and the yard area measured on the 3D. It is not the terminal’s own count and should not be read as one.
±10%on the scale everything spatial rests onWhich is why the speeds are estimates and the area figure carries a range.
258 framesfour stock clips in the main 3DMeasured. One hour forty minutes from footage in to the main 3D, on a single desktop graphics card.
The container terminal in 3D with the yard blocks labelled and the figures read from the footage listed in a side panel
The yard measured on the 3D, with the stacks counted by AI on the real frames rather than off the model. The box count is an estimate given as a range, and it is not the terminal’s own count.
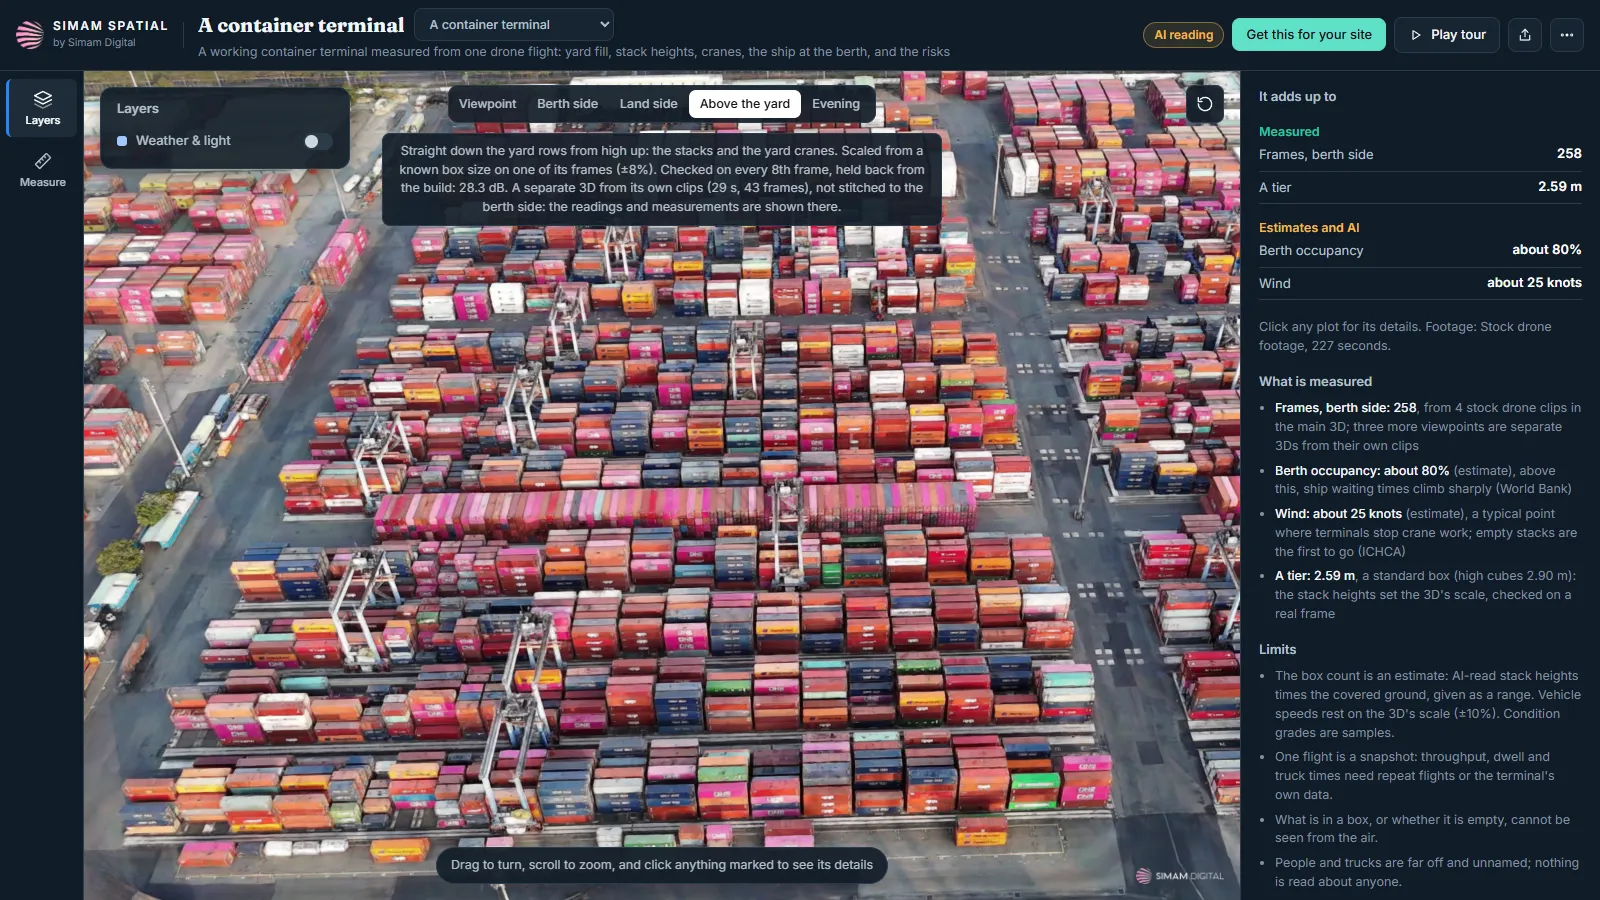
The container yard seen straight from above as its own separate 3D, with a switcher between viewpoints
Four viewpoints, each built as its own 3D and one tap apart. Nothing is stitched: the clips that saw the yard from other sides would not join, so they were kept separate rather than forced into one ghosted model.
Honestly

What this is not.

The 3D is not good enough to publish

From this footage. That is stated here rather than worked around, and it is the reason there is no demo to open.

Not the terminal’s own numbers

The box count is our estimate as a range. Their count is theirs and we do not have it.

Where a surveyed figure exists, it wins

The yard area everything else rests on was measured on a 3D carrying about ten per cent. A surveyed area beats it, and so does the terminal’s own record of its own yard.

A snapshot, not a shift

One flight measures what moved while it was flying. Anything about rates over a day needs repeat flights.

No saving is claimed, because none was measured

Nothing about time or cost in a real terminal was measured here, so there is no figure for it.

Built on stock footage, as our own demonstration. Nobody commissioned it: it exists to show what the method does on a working industrial site rather than on a tidy one. The site and its operator are not named here and are not ours to name.

Questions we get asked

Before you ask.

You said part of it did not work. Which part?

The 3D. The stock clips are long, straight, high passes, so the stacks and the cranes never get enough angles and the reconstruction came out too soft to put in front of anyone. The tracking and the counts stand, because both are read from the real frames rather than from the model. The 3D needs a proper orbit flight of the yard, and until that happens there is no demo of it.

Why publish that?

Because the alternative is a page that implies all of it worked. Which half of a method holds up on which kind of footage is the single most useful thing we can tell somebody thinking about flying their own site.

Is the box count the terminal’s count?

No, and it must not be read as one. It is an estimate from an AI count of the stacks and the measured yard area, published as a range of 7,600 to 12,900 TEU. The terminal’s own figure is the terminal’s, and we do not have it.

How reliable are the speeds?

They are estimates. Every frame has a solved camera position, so the software knows how the ground should move and anything moving differently is a vehicle. Turning that into metres per second relies on the 3D’s scale, which carries about ten per cent.

Is thirty seconds enough to say anything?

It is enough to measure what moved in those thirty seconds and not enough to describe a shift. Moves per hour and dwell time need repeat flights, and the page does not pretend one pass gives you them.

What else went wrong?

Stack heights read off the 3D were too noisy to count boxes, so the counting moved onto the real frames. Water basins were first picked up as moving vehicles, because still water moves differently from the ground; only solid ground is searched now. And the first 3D only saw the yard from the berth side and looked one-sided.

Whose terminal is it?

Stock footage of a working deep-water terminal. The terminal, its operator and the shipping lines are not named and are not ours to name. Nobody commissioned this.

What would you fly differently?

Orbits at two heights over the yard rather than straight passes, which is the whole of what the 3D needed. Then the reconstruction is worth publishing and the counts get a model to sit on.
Got a site that moves while you are trying to count it?

Tell us what it is and what you need to know about it. We will say whether this would answer it, including when it would not, and this page is what that sounds like.

Ask about a site like this