Decision-makers lack one operating picture
Project teams may depend on status calls, spreadsheets, photos, drawings, emails, and separate planning tools. That slows down decisions and hides risk.
Construction Command Center was developed as a private innovation project to show how construction and infrastructure teams could bring maps, workflows, safety, progress, assets, and reporting into one practical digital twin-style interface.
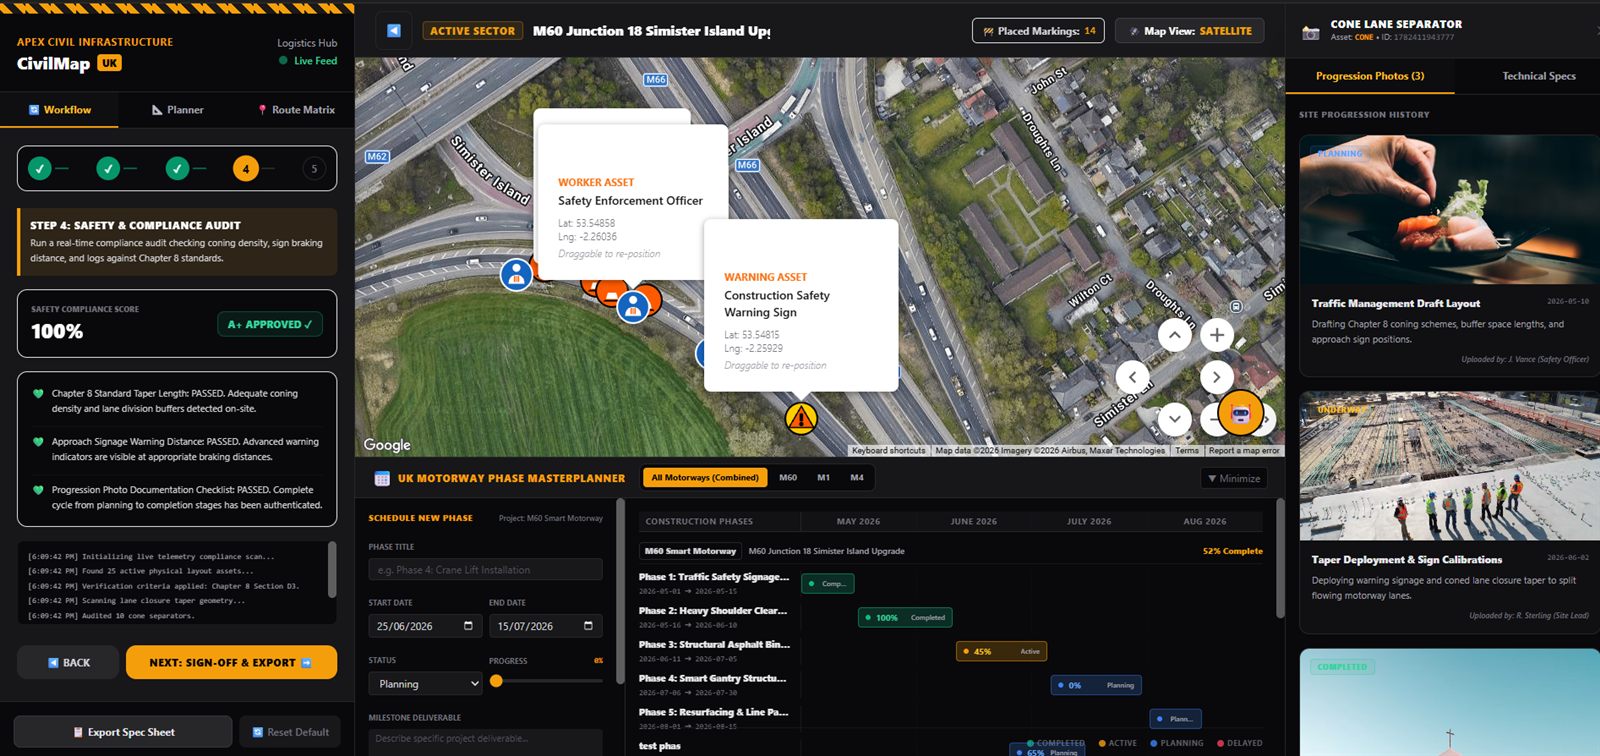
Planning, inspection, safety, progress, and reporting are treated as connected actions. The product story begins with what needs attention and ends with a visible decision or update.
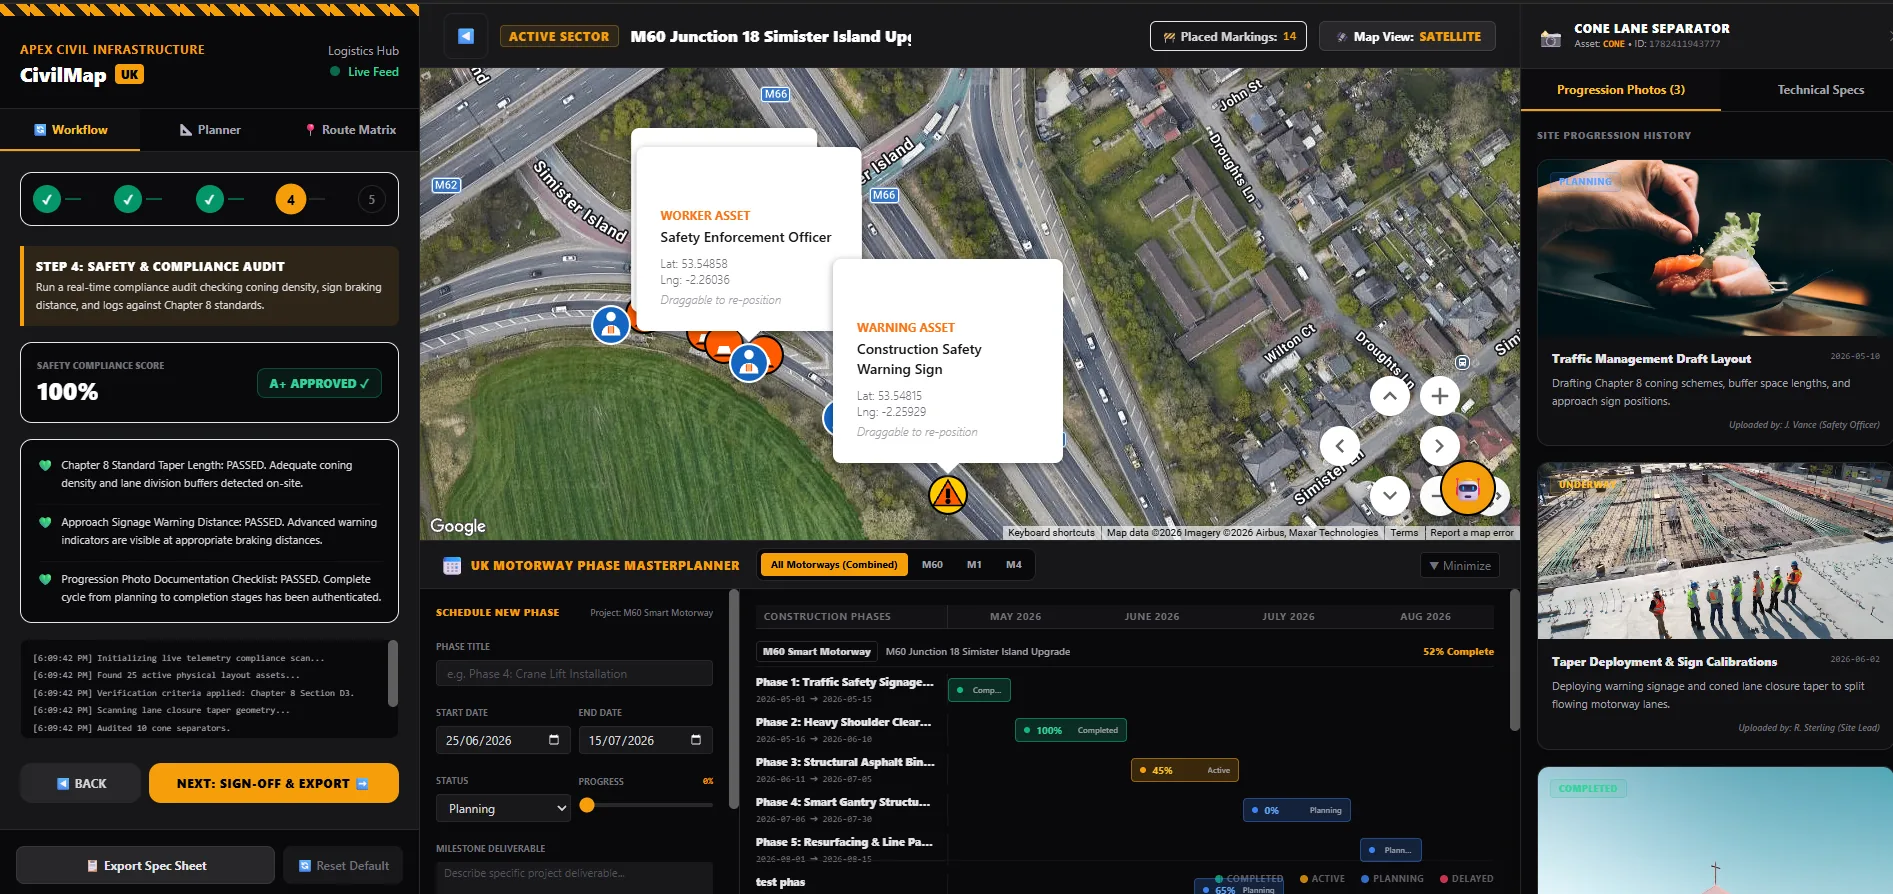
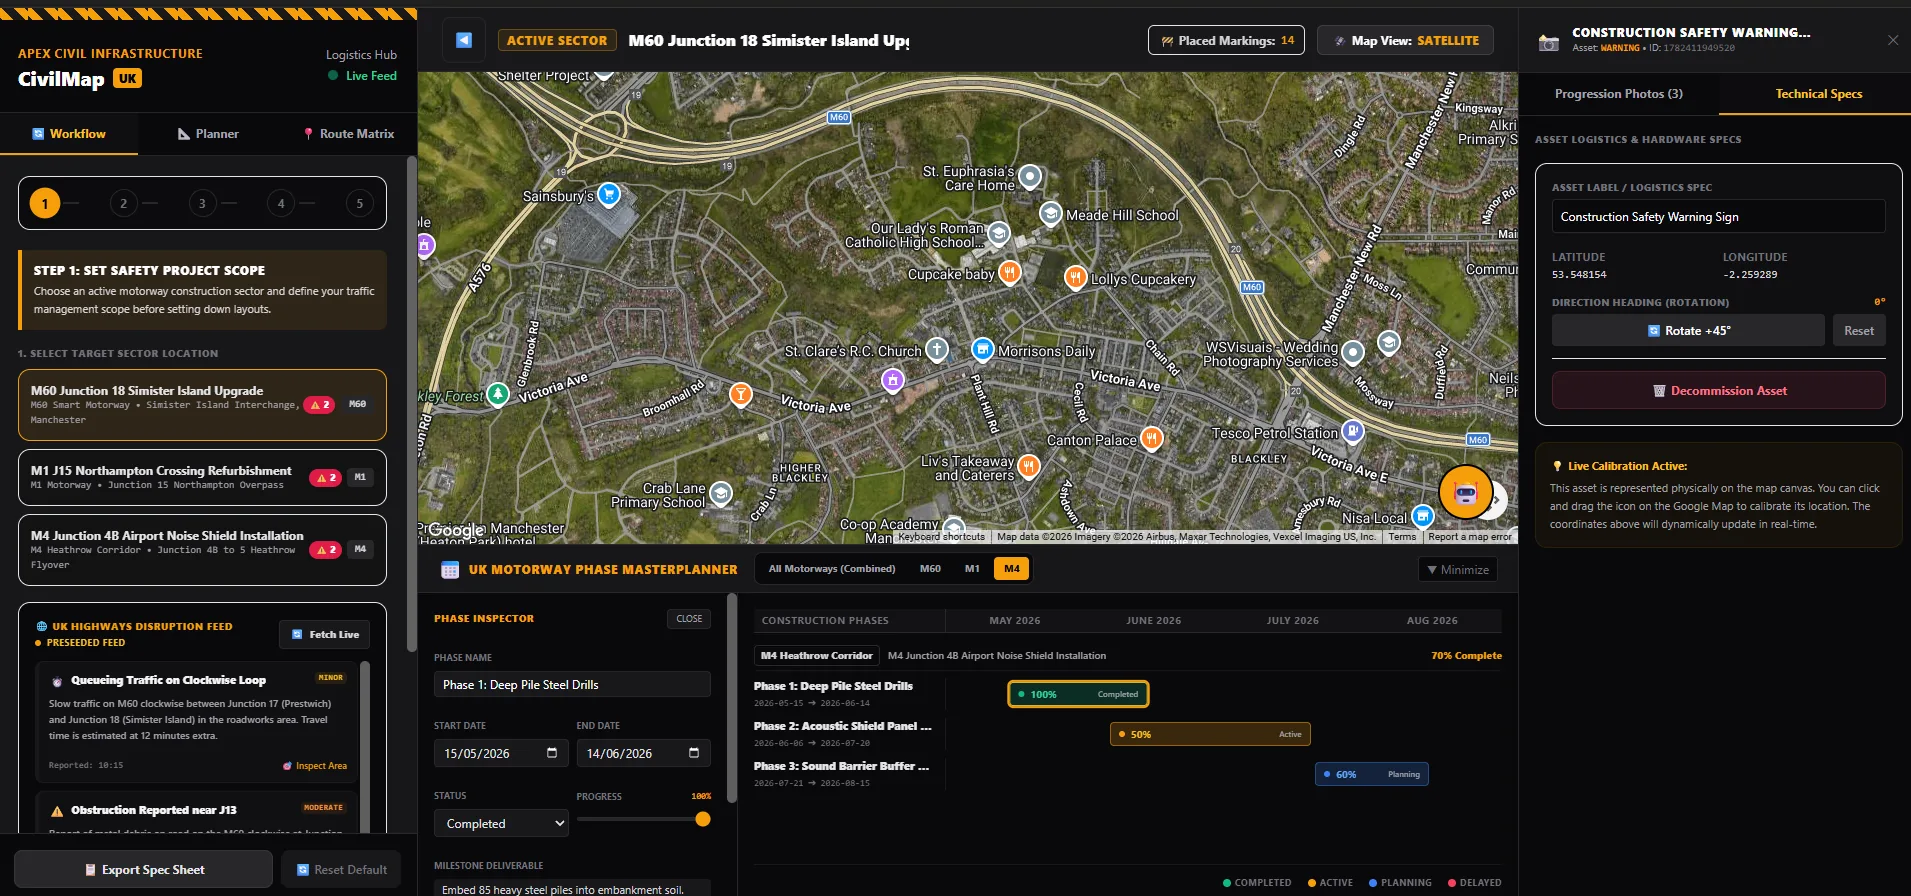
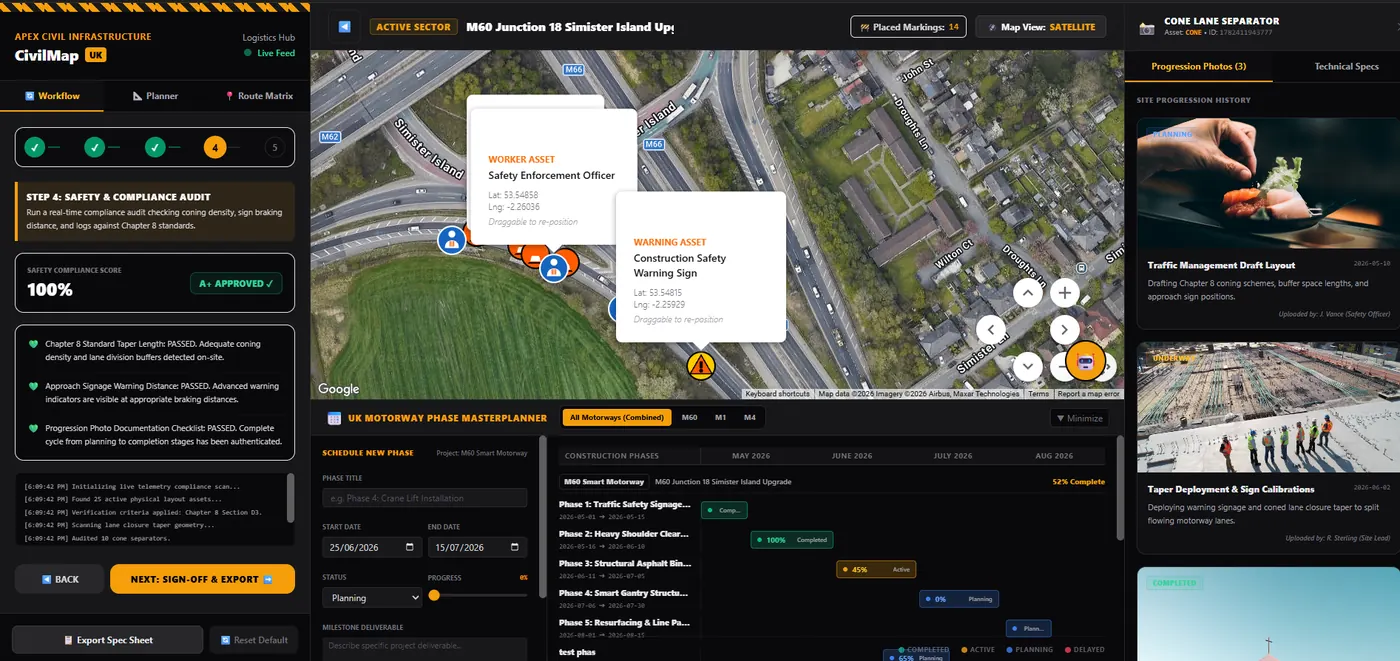
What this proves: a focused prototype can reveal which construction workflows deserve integration first, helping teams avoid a costly platform that reproduces existing complexity.
Construction projects are full of moving parts: people, assets, documents, risks, inspections, schedules, suppliers, site conditions, and stakeholder updates. The challenge is not a lack of information; it is turning information into action.
Project teams may depend on status calls, spreadsheets, photos, drawings, emails, and separate planning tools. That slows down decisions and hides risk.
A command center can unify project lists, live maps, assets, alerts, inspections, workforce data, phase planning, and progress reporting.
The concept makes the value visible: plan better, inspect faster, manage risk, coordinate teams, and report progress with less manual effort.
Construction products need buyer confidence because the real-world complexity is high. A prototype allows teams to test the screen, workflows, language, data model, and decision-making value before investing in a heavy implementation.
The prototype helps reveal whether the workflow matches how planners, safety teams, site managers, and leadership actually operate.
Instead of describing a platform in abstract terms, teams can point to screens and discuss what would be used, changed, removed, or integrated.
The concept helps separate a useful MVP from a long wishlist: projects, map view, alerts, phase plan, asset status, and reports may come before deeper automations.
A construction prototype can sit in the £5,000 to £20,000 range depending on depth. Production cost depends on data sources, users, permissions, integrations, reporting, and support needs.
The product needed to prove that a construction dashboard could feel like an active control room without becoming visually overwhelming or purely decorative.
The interface starts with workflow steps and active project cards so users know what stage they are in and what needs attention.
The satellite map brings safety zones, project areas, incidents, inspections, and asset positions into a shared visual context.
Alerts, warnings, inspection overdue states, decommission actions, and safety panels are treated as core workflow items rather than secondary notes.
The phase planning area shows how progress, dates, workforce, and package status can feed reporting, stakeholder updates, and project review meetings.
The cost depends on whether the project is a visual demonstrator, a pilot for one construction programme, or a production product connected to live data and business systems.
Best for showing the command center idea, major screens, sample data, and a convincing product direction.
Best for a deployed web app with project data, dashboards, map views, workflow screens, and early reporting.
Best for authentication, permissions, integrations, audit trails, live data, document/report exports, and maintained delivery foundations.
Simam Digital can help construction and infrastructure teams turn messy operational requirements into a clear product roadmap, a working demo, and then a production-ready software plan.
Translate a vague idea into a clear product direction, user journey, feature set, and commercial demo story.
Design dashboard, map, spatial, simulation, or 3D product flows that non-technical stakeholders can understand quickly.
Create clickable or working prototypes with modern web, AI workflow, real-time 3D, API, and deployment foundations.
Package the work so it can support client workshops, funding conversations, sales demos, internal buy-in, or pilot proposals.
A concise record of what the project was intended to prove, the evidence available today, and the next responsible investment step.
A fixed-scope sprint can turn the idea into a visible command center, helping you win internal buy-in before deeper platform investment.