Project data lives in separate places
Maps, drawings, safety notes, traffic data, asset registers, photos, schedules, and reports can sit across different tools and teams.
Connected Highways was developed as a private innovation project to demonstrate how road corridors and civil infrastructure projects can be managed through one visual command surface: map context, assets, warnings, teams, progress, and decisions.
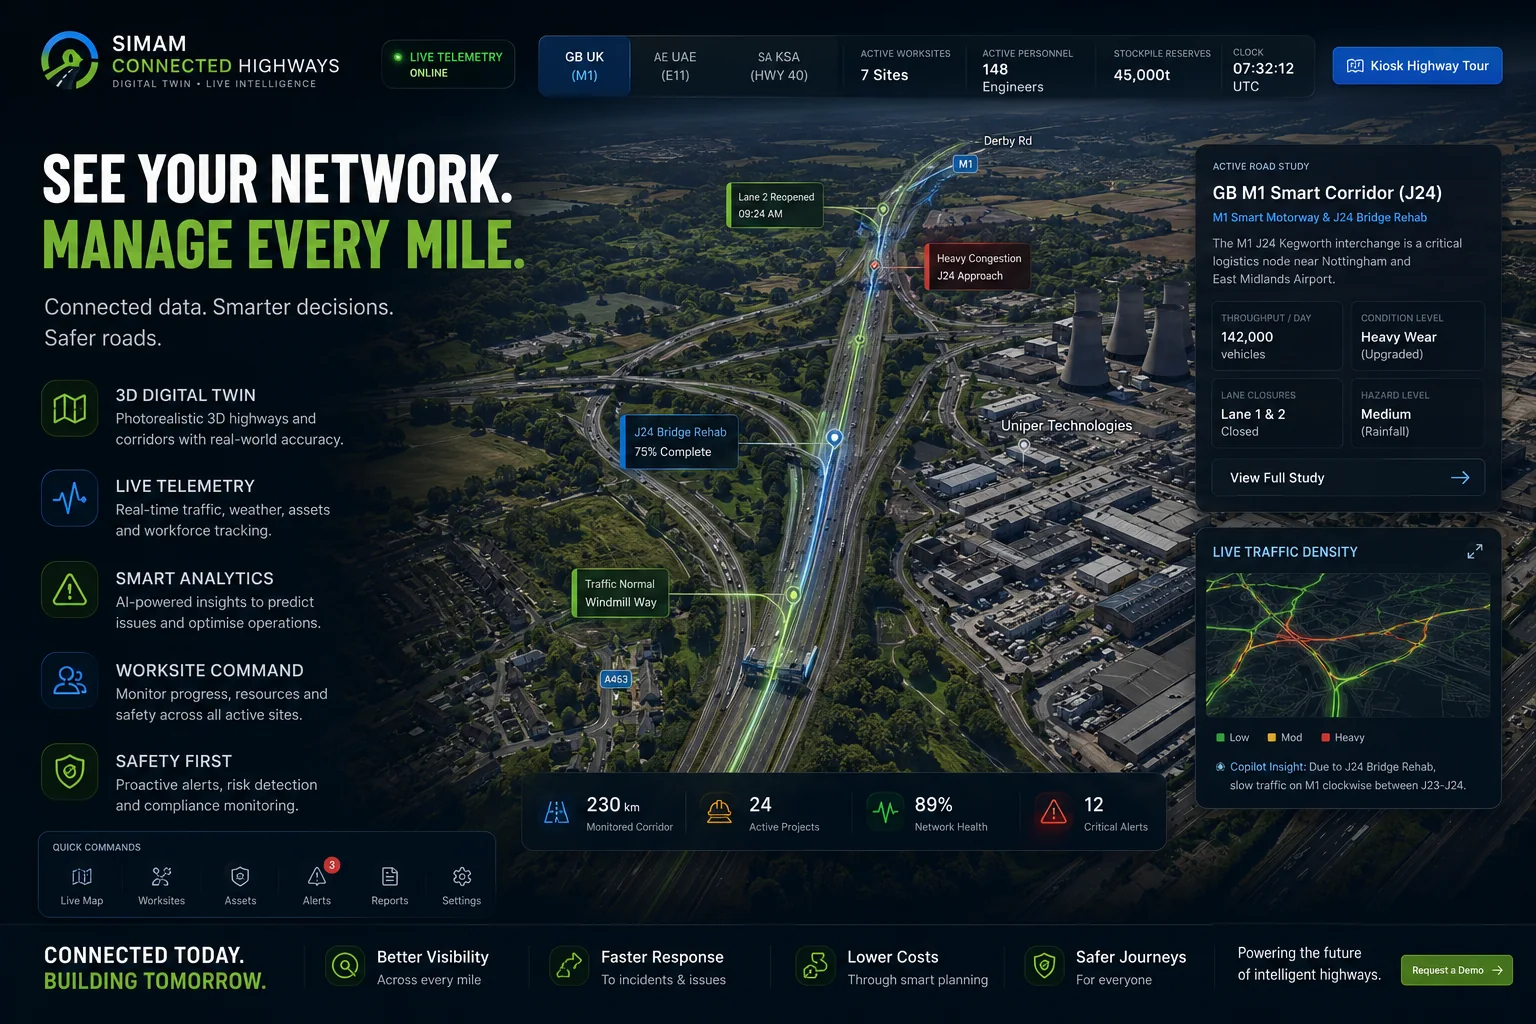
The prototype explores how the same road programme can be viewed through project delivery, live map context, asset status, safety, and phase planning rather than forcing every role into a generic dashboard.
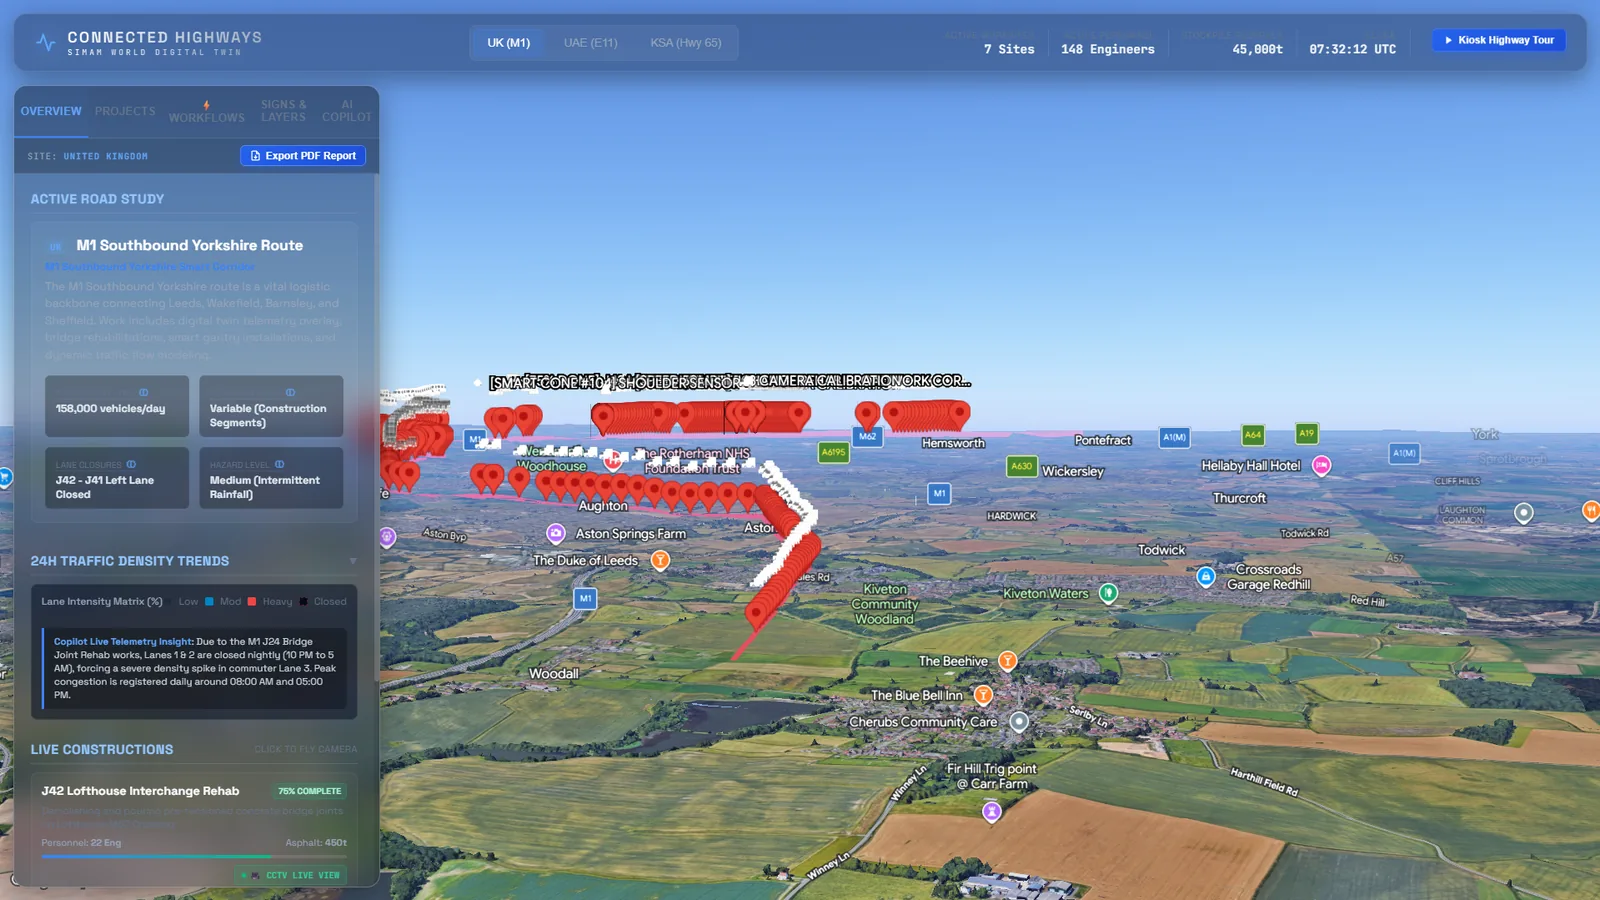

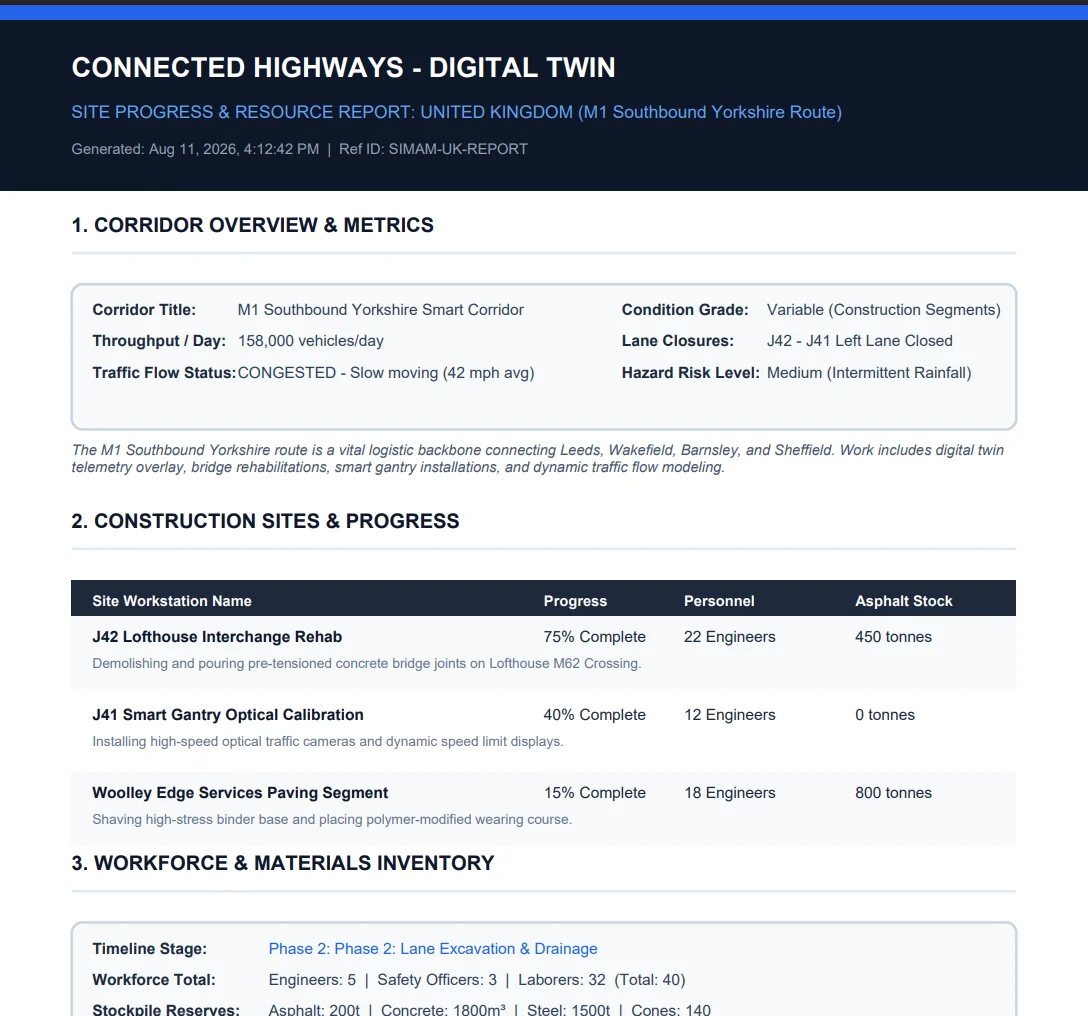
What this proves: stakeholders can test the operating model, data entities, and key decisions before expensive GIS licensing, data migration, and enterprise integration work begins.
Infrastructure teams often have data, but not always a shared operational picture. The value of a digital twin is not the 3D label itself; it is the ability to make decisions from visible, joined-up context.
Maps, drawings, safety notes, traffic data, asset registers, photos, schedules, and reports can sit across different tools and teams.
A map-led command view can give planners, project managers, inspectors, and leadership teams a shared interface for what is happening and what needs attention.
The concept shows live project lists, filtered markups, satellite context, asset detail, warnings, collaboration, and a phase masterplanner in one coherent product story.
Infrastructure software can become expensive quickly because every organisation has different GIS sources, asset models, reporting standards, integrations, and approval workflows. A prototype is the sensible first step because it clarifies the actual operating model before committing to production integrations.
A visual sprint helps teams agree what the dashboard should do before engineering effort is spent on deep integration and data migration.
Leadership, safety, delivery, and field teams can respond to the same screen and discuss what is useful, missing, or operationally unrealistic.
The prototype reveals which entities matter first: projects, corridors, assets, inspections, incidents, traffic layers, warnings, milestones, and responsible teams.
A clickable or semi-functional prototype may start from the £5,000 to £20,000 range. Production work depends on GIS providers, security, data pipelines, reporting, and integration scope.
The product needed to prove that a highway corridor could be understood as a live operational system rather than a stack of documents and separate dashboards.
The left-side workflow keeps project selection, safety setup, active projects, and recent alerts in the same visual language as the map.
The map carries routes, filtered markups, incidents, inspections, assets, and context. It becomes the place where decisions are grounded.
The right panel gives selected asset information, safety warnings, location details, and actions, making the concept feel operational rather than purely visual.
The phase masterplanner links dates, progress, workforce, and construction stages so buyers can see how planning and field visibility could connect.
The biggest cost variables are integration depth, GIS licensing, asset schema complexity, realtime data, reporting requirements, security, and whether the tool is for a pilot, an internal team, or a full operational rollout.
Best for one corridor or use case, a mapped workflow, sample asset data, and a stakeholder-ready demo.
Best for a deployed dashboard with representative data, map layers, alert logic, reporting screens, and user feedback cycles.
Best for real GIS/data integrations, authentication, permissions, audit trails, reporting exports, ongoing support, and maintainable architecture.
Simam Digital can support the early product phase where teams need to convert infrastructure complexity into a product that can be reviewed, funded, piloted, and then developed responsibly.
Translate a vague idea into a clear product direction, user journey, feature set, and commercial demo story.
Design dashboard, map, spatial, simulation, or 3D product flows that non-technical stakeholders can understand quickly.
Create clickable or working prototypes with modern web, AI workflow, real-time 3D, API, and deployment foundations.
Package the work so it can support client workshops, funding conversations, sales demos, internal buy-in, or pilot proposals.
A concise record of what the project was intended to prove, the evidence available today, and the next responsible investment step.
A digital twin sprint can help you define the operating view, test the workflow, and build a credible demo before expensive integration work begins.